In today’s competitive business world, measuring the right Key Performance Indicators (KPIs) is crucial for optimizing your supply chain and driving growth. Below are 10 essential KPIs every supply chain manager should track for better performance and decision-making.

1. Perfect Order
Perfect Order is a measure of how accurately and timely an order is delivered to customers, ensuring there are no mistakes or delays. This includes everything from the right products being delivered to customers at the promised time.
Formula: Perfect Order is calculated by dividing the total number of error-free orders by the total number of orders, then multiplying the result by 100 to get the percentage of perfect orders.
Example: If you received 100 orders in a month and 5 of those had errors (wrong items, late delivery, etc.), the percentage of perfect orders would be 95%.
2. Cash to Cash Cycle Time
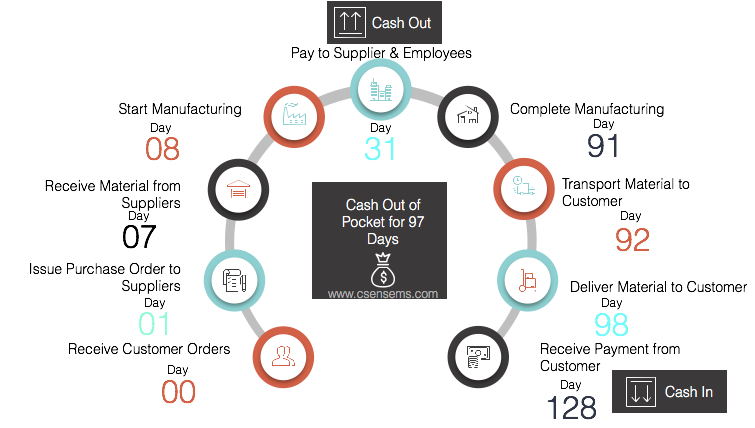
This KPI measures how long it takes for a company to convert its investments in inventory into cash flow from sales. Essentially, it’s the time taken from paying for materials to receiving customer payments.
Example: If a company pays for materials on January 1st and receives payment for customer orders on January 15th, the Cash to Cash Cycle Time is 15 days.

3. Customer Order Cycle Time
Customer Order Cycle Time measures the total time it takes from when a purchase order is created to when the product is delivered to the customer. It’s a key indicator of how fast and efficient your order fulfillment process is.
Example: If an order is placed on March 1st and delivered on March 5th, the Customer Order Cycle Time is 4 days.
4. Fill Rate
The Fill Rate shows the percentage of customer orders that are fully completed with the correct quantity and items. A higher fill rate indicates better inventory management and order fulfillment.
Example: If 500 items were ordered but only 450 were shipped, the Fill Rate would be 90%.
5. Inventory Days of Supply
This metric tells you how many days the current inventory will last based on the average daily usage of inventory. It’s a useful KPI for understanding your stock levels and whether you’re overstocking or understocking.
Example: If a company has 1,000 units of inventory and uses 50 units per day, the inventory will last for 20 days.
6. Freight Bill Accuracy
Freight Bill Accuracy measures how many of the freight bills are correct compared to the actual shipments. High accuracy in freight billing helps reduce errors and prevent overcharging.
Example: If there are 200 freight bills, and 190 of them are correct, the Freight Bill Accuracy would be 95%.
7. Days Sales Outstanding (DSO)
Days Sales Outstanding measures how long it takes a company to collect payments from customers after a sale has been made. This is important for understanding cash flow and the efficiency of your accounts receivable processes.
Example: If a company has $10,000 in receivables, $50,000 in sales, and a 30-day period, the DSO would be 6 days.
8. Inventory Turnover
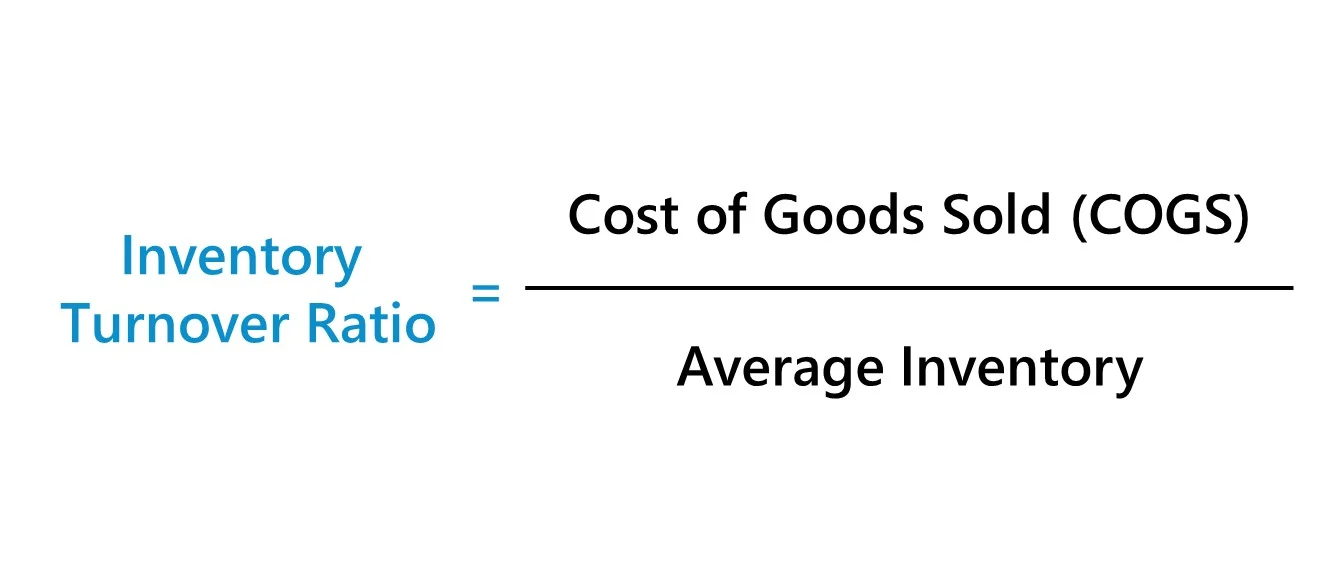
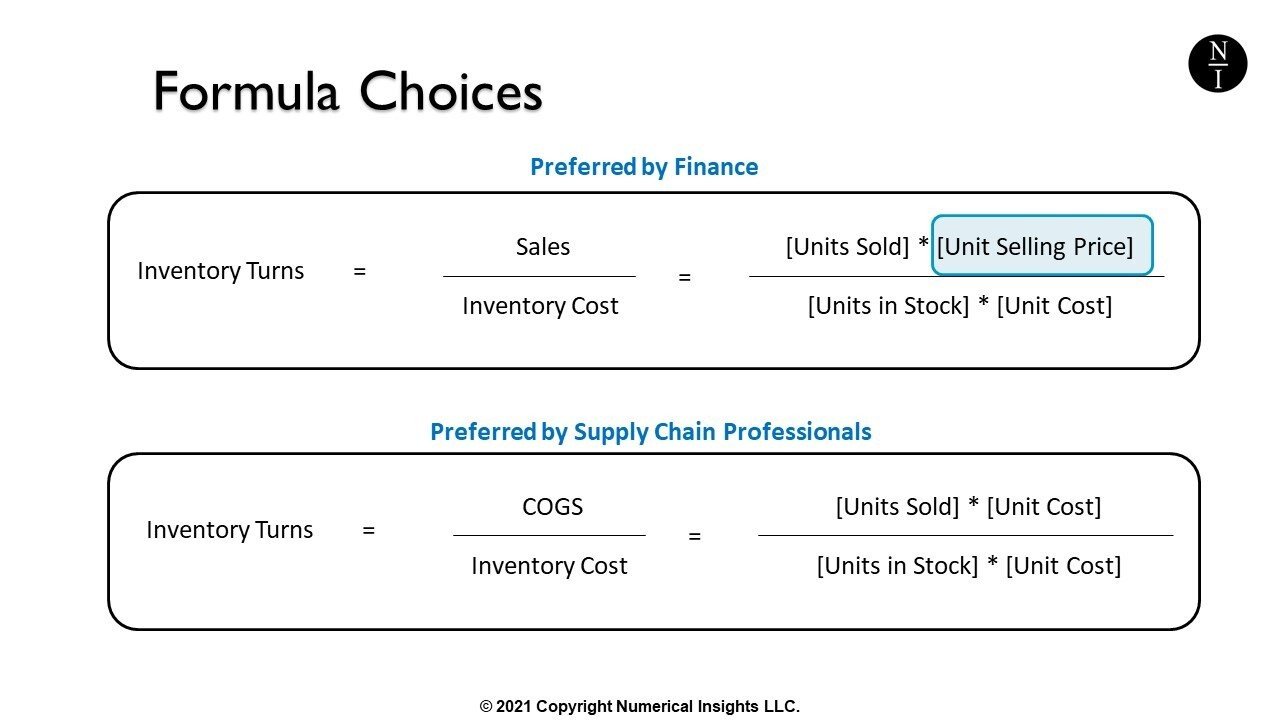
Inventory Turnover tells you how quickly inventory is sold and replaced over a period of time. It helps assess whether you’re efficiently managing inventory and keeping stock levels in check.
Example: If a company sells $100,000 worth of goods in a period and the average inventory is $20,000, the Inventory Turnover rate would be 5 times.

9. Gross Margin Return on Investment (GMROI)
GMROI measures the return on the investment in inventory, indicating how efficiently inventory is being used to generate profit. A higher GMROI means the company is generating more profit from its inventory investments.
Example: If a company has a gross profit of $50,000 and an average inventory of $25,000, the GMROI would be 200%.
10. Inventory Velocity
Inventory Velocity measures how quickly inventory is expected to move or be sold based on sales forecasts. This KPI helps ensure that inventory is being replenished efficiently and matches the demand.
Example: If a company has an opening stock of $50,000 and expects to sell $100,000 worth of goods in the next period, the Inventory Velocity would be 0.5.

Tracking these 10 KPIs will allow supply chain managers to monitor performance, identify inefficiencies, and optimize their processes for better decision-making. By understanding and acting on these KPIs, companies can improve their operations, enhance customer satisfaction, and boost
#SupplyChainKPIs #SupplyChainManagement #KeyPerformanceIndicators #BusinessOptimization #SupplyChainExcellence #LogisticsManagement #BusinessGrowth #InventoryManagement #DataDrivenDecisions #SupplyChainEfficiency #OperationalExcellence #BusinessAnalytics #SupplyChainInsights #PerformanceMetrics #ManufacturingExcellence


